Suivi de la qualité de l’eau dans le bassin du Mékong au Laos
Les variables suivies dans le bassin du Mékong au Laos sont les concentrations d’Escherichia coli et la physico-chimie de l’eau des cours d’eau. Les mesures physico-chimiques comprennent la température de l’eau, la conductance électrique à 25 °C, la concentration et la saturation en oxygène dissous, le pH, le potentiel d’oxydoréduction, la turbidité et la concentration en matières en suspension.
Les détails sur le dispositif de suivi et sur les variables mesurées selon une approche multi-échelle dans le bassin du Mékong au Laos sont disponibles ici.

Suivis hydro-météorologiques et pertes en terres dans le bassin versant de Houay Pano
Les variables suivies dans le bassin versant de Houay Pano sont : pluie 6-min et journalière, variables météorologiques horaires (vitesse du vent, humidité relative, radiation solaire, température), niveau d’eau apériodique, matières en suspension et charriage de fond apériodiques, et usage des terres annuel. A l’échelle de la microparcelle, les variables suivies sont les états de surface, le ruissellement de surface, et les pertes en terre.
Plus d’information sur le dispositif d’observation et sur les variables mesurées dans le bassin versant de Houay Pano ici.
Les eaux souterraines sont également suivies au sein du bassin versant de Houay Pano grâce à des piézomètres automatiques et manuels, et grâce à la tomographie de la résistivité électrique (ERT).


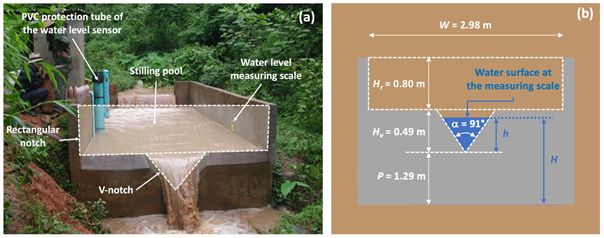
Caractéristiques géométriques de la station S4, exutoire du bassin versant de Houay Pano
Variables suivies dans le bassin du Mekong
| Variable (Unit) | Frequency | Method | Precision | Timeframe | ||
| Land Use | ||||||
| Spatial localisation | Yearly | Garmin GPS 12XL | 15 m | 1998–2005 | ||
| Garmin eTrex euro GPS | 10 m | 2006–2008 | ||||
| Garmin eTrex 10 GPS | 5 m | 2009–2015 | ||||
| Garmin GPSmap 60CSx | 3 m | Since 2016 | ||||
| Meteorology | ||||||
| Rainfall (mm) | Daily | 7 water level gauges (Homemade according to World Meteorological Organization standards) | 0.1 mm | Since 2001 | ||
| 6 min (Cimel) 1 min (Campbell) | Cimel ENERCO 407 (from 2001 to 2012); Campbell BWS200 with ARG100 – 0.2 mm capacity tipping-bucket (since 2013) | 0.5 mm (Cimel); 0.2 mm (Campbell) | ||||
| Air temperature (°C) | Hourly | 0.02°C (Cimel); 0.4°C (Campbell) | ||||
| Air relative humidity (%) | 0.5% (Cimel); 4% (Campbell) | |||||
| Wind speed (km h-1) | 10% (Cimel); 0.1 km/h (Campbell) | |||||
| Global radiation (J cm-2) | 0.05 J/cm2 (Cimel); 0.02 J/cm2 (Campbell) | |||||
| Soil surface features | ||||||
| Slope gradient | Flood event | 1-m2 microplot | 1 % | 2000-2016 | ||
| Areal % of free aggregates, free gravel, structural crust, erosion crust, gravel crust, charcoals, and residues | 5 %, 1 %, 5 %, 2 %, 2 %, 1 %, 5 % | |||||
| Areal % of worm casts and termite pellets, algae, mosses, crop and tree cover, weed and fallow cover at the soil surface | 1 %, 0.5 %, 0.5 %, 5 %, 5% | |||||
| Crop and tree height | 5 cm for crops, 200 cm for trees | |||||
| Weed and fallow height | 2 cm for weed, 20 cm for fallow | |||||
| Areal % of pedestal cover, pedestal maximum height, and pedestal mean height | 2 %, 0.5 cm, 0.5 cm | |||||
| Soil surface runoff and soil detachment | ||||||
| Surface runoff (mm) | Flood event | 1-m2 microplot | 5 mm | 2000-2016 | ||
| Soil detachment (g m-2) | 50 g m-2 | |||||
| Geophysics | ||||||
| Electrical resistivity tomography survey | 2003, 2005-2007, 2012, 2014-2015, 2024 | SYSCAL R2 (2003) and SYSCAL Pro (2005-2024) | 0.2 % | 2003-2024 | ||
| Electrical resistivity tomography time-lapse monitoring | Flood event up to 15-day time interval | SYSCAL R2 (2006-2007, 2010-2019) and SYSCAL Pro (2007-2010, 2019) | 0.2 % | 2006-2019 | ||
| Water and particulate transport at the station S4 (~1 km²) | ||||||
| Water level (cm) | 30 s | OTT Thalimedes | 0.1 cm | Since 2001 | ||
| Suspended particulate matter (g L-1) | Flood event | Automatic Pumping Type Sediment Sampler, ICRISAT | 0.01 g/L | |||
| Bed particulate matter (ton ha-1) | Monthly and/or flood event | Homemade concrete weirs | 0.001 ton/ha | |||
| Water quality at the 7 sampling stations (~1 to ~300,000 km²) | ||||||
| E. coli (MPN 100 mL-1) | 10 days | MUG/EC microplates on grab samples | Uncertainty is given by the Poisson law for each sample | Since 2011 or 2017 (Nou_1, Nse_1: 2017-2024) | ||
| Temperature (°C) | YSI 556-MPS (from 2011 to 2022); YSI Pro Quatro (since 2022) | ±0.15 C° (YSI 556-MPS); ±0.2 C° (YSI Pro Quatro) | ||||
| Electrical conductance (µS cm-1) at 25 °C | ±0.5 % | |||||
| Dissolved oxygen saturation (%) | ±2 % | |||||
| Dissolved oxygen concentration (mg L-1) | ±2 % | |||||
| pH (-) | ±0.2 | |||||
| Oxidation-reduction potential (mV) | ±20 mV | |||||
| Turbidity (NTU) | Portable turbidity meter (EUTECH Instruments TN-100) | ±2 % (0-500 NTU); ±3 % (501-1000 NTU) | ||||
| Suspended sediment concentration (g L-1) | Grab samples | |||||